Revenue has numbers.
₹42.7 crore against a target of ₹45 crore. Down 5.1% quarter on quarter. Two stalled deals accounting for the majority of the shortfall. Decision required on whether to adjust the Q3 forecast or accelerate pipeline.
That sentence contains five numbers and one decision prompt. It is what a board needs to govern. It is what finance has been delivering for decades.
Now consider what every other department delivers to the same board.
- Sales: “The pipeline is healthy, and we are seeing good momentum.”
- HR: “The team is in good shape. Attrition is under control.”
- Operations: “Production is on track and quality is stable.”
- IT: “Our systems are secure, and we are compliant.”
- Vendors: “Vendor relationships are being managed closely.”
- Compliance: “We are aligned with all applicable regulations.”
These are words. Not one of them contains a number. Not one of them is governable. Not one of them tells the CEO, CFO, or board member what decision is required or what trend is emerging.
The companies that grow with confidence, that respond to problems before they become crises, and that govern across every department with the same rigour they apply to revenue, are the ones that have solved this problem. They have replaced departmental narrative with departmental numbers. Not for every metric that exists. For the six to eight numbers that actually matter in each domain. Consolidated, trended, threshold-bound, and delivered to leadership in a single view.
The Asymmetry That Every CEO Lives With
There is an asymmetry at the centre of how most companies are run, and most CEOs have lived with it so long they have stopped seeing it.
Financial performance is fully numerical. Every board member can look at the P&L, the balance sheet, the cash flow statement, and answer the question: how is the company doing, and where does it need attention? The numbers are standardised. They trend. They compare to targets. They generate decisions.
Operational performance across every other department is largely narrative. The CFO presents numbers. Everyone else presents words.
This asymmetry is not the result of a deliberate decision. It evolved. Finance had reporting infrastructure first. Other departments adopted technology later. The CEO’s operating cadence was built around financial numbers because those were the only numbers that existed.
In 2026, every other department in a well-run company generates data every day. Sales data in CRM systems. HR data in people management platforms. IT and security data in monitoring tools. Operations data in ERP and MES systems. Vendor data in procurement platforms. Customer data in service management systems.
The numbers exist. They simply do not reach the CEO or board in a consolidated, actionable format. They are buried in department-level tools. They surface as stories in team meetings. They are compressed into slide decks that arrive at board level as paragraphs of context and the occasional supporting chart.
The asymmetry is not a data problem. It is a translation problem.
What Every Department Is Actually Telling the CEO in Words Versus What the Numbers Say
Let us make this concrete. This is the conversation that happens versus the conversation that should happen, department by department.
Sales
What the team says: “Pipeline is healthy. We have strong momentum going into Q3. A few deals pushed out, but we expect to recover.”
What the numbers show:
- Pipeline value: ₹18.4 crore
- Target pipeline for Q3 close: ₹22 crore. Gap: ₹3.6 crore.
- Deals stalled over 45 days: 7, representing ₹8.1 crore
- Average deal cycle time: 67 days vs 54-day target
- Conversion rate last quarter: 31% vs 38% same quarter prior year
The word “healthy” conceals a ₹3.6 crore gap, seven stalled deals, and a declining conversion trend. Each of those numbers requires a specific decision. The word “healthy” requires no decision at all.
Human Resources
What the team says: “Attrition is under control. The team is engaged, and we have some open positions we are working on.”
What the numbers show:
- Monthly attrition rate: 4.2% vs 2.8% target
- Annualised attrition: 50.4%
- Open positions: 23, with average age 67 days
- Positions open over 90 days: 8, including 3 in revenue-generating roles
- Absenteeism rate: 8.1% vs 4% target
- Training completion rate: 61% against mandatory 85%
The phrase “under control” at 4.2% monthly attrition describes a company losing half its workforce on an annualised basis. That is not an HR conversation. That is a CEO conversation. But the CEO never had it because the number never reached them in a format that demanded attention.
Operations and Manufacturing
What the team says: “Production is on track. We had some downtime earlier in the month, but it has been resolved, and quality is stable.”
What the numbers show:
- Overall Equipment Effectiveness: 71% vs 82% target
- Unplanned downtime this month: 34 hours vs 8-hour target
- Rejection rate: 1.8% vs 0.8% target
- On-time delivery to customers: 83% vs 96% target
- Order backlog beyond committed delivery date: 147 units
“Stable” at a 1.8% rejection rate is costing the company material, labour, and customer delivery commitments simultaneously. The downtime is not resolved. It is below the number required for the month but above every historical target. The CEO who received this as “on track” made no decision. The CEO who received 71% OEE against an 82% target made several.
Finance and Liquidity
What the team says: “Cash position is comfortable. Collections have been a bit slow, but we expect to catch up.”
What the numbers show:
- Days Sales Outstanding: 78 days vs 45-day target
- Overdue receivables over 90 days: ₹6.2 crore
- Cash runway at current burn: 3.8 months
- Budget variance: -12% on operating expenses
- Accounts payable days: 91 days, creating supplier relationship risk
A 3.8-month cash runway is not “comfortable.” It is a board-level decision about fundraising, cost reduction, or collections acceleration. The number surfaces that decision. The word does not.
IT and Technology
What the team says: “Systems are running well. We completed our last audit in March and are compliant.”
What the numbers show:
- System availability across critical applications: 97.2% vs 99.5% target
- Patch compliance on production systems: 74%
- Open IT audit findings: 11, of which 4 are past remediation SLA
- Vendor SLA compliance: 81% vs 95% contracted
- Last VAPT completion: 8 months ago
- Mean time to resolve IT incidents: 6.4 hours vs 2-hour SLA
“Running well” with a 74% patch compliance rate means 26% of production systems are unpatched. “Compliant” with 11 open audit findings means the compliance is nominal, not operational. These numbers surface decisions. The narrative suppresses them.
Vendor and Supply Chain
What the team says: “Vendor relationships are being managed. We had a few delivery delays but nothing critical.”
What the numbers show:
- Active critical vendors: 34
- Vendors with current security assessments: 11 of 34 (32%)
- Vendor SLA breaches this quarter: 8, affecting 3 production lines
- Sole-source dependency: 6 components have a single supplier
- Vendor payment terms compliance: 67%
- Pending vendor contract renewals: 5 within 60 days
“Nothing critical” describes a supply chain where 68% of critical vendors do not have current security assessments and 6 components have no alternative source. The CEO who governs by this word is one vendor failure away from discovering what “critical” actually means.
Compliance and Regulatory
What the team says: “We are aligned with all applicable regulations. The audit went well.”
What the numbers show:
- Open regulatory findings: 7
- Findings past resolution deadline: 3
- Upcoming regulatory submission deadlines: 4 in the next 60 days
- Policy review currency: 6 of 14 policies due for review are overdue
- Training completion for mandatory compliance modules: 58%
- Previous audit findings fully closed: 9 of 16
“Aligned” with 3 findings past deadline and 4 upcoming submission deadlines is not alignment. It is accumulated risk that the word “aligned” has made invisible to the people responsible for governing it.
The Three Questions Every CEO Should Be Able to Answer Without Calling Anyone
Before the next board meeting, before the next executive team call, before the next investor conversation, every CEO should be able to answer three questions about their company without picking up the phone.
Where is the company performing below target right now?
Not what the team told them last week. Right now. Which departments have metrics below threshold? Which trends are declining? Where is something getting worse this month compared to last month?
Where is the company carrying risk that requires a decision this week?
Not a risk register reviewed in the last quarterly board pack. A live view of what risks are open, what their current status is, and which ones have passed the threshold that requires an executive decision rather than a management response.
Are our key investments delivering measurable returns?
Not a narrative about what each investment was supposed to achieve. A number. Revenue per sales headcount. Technology investment against incident frequency. Training spend against quality outcomes. The measurement that tells whether the investment is working before the next budget cycle.
Most CEOs cannot answer any of these three questions without making calls, pulling reports from different systems, waiting for department heads to compile data, and then receiving a narrative that has been assembled for them rather than a number that exists independently.
That dependency is manageable when things are going well. It is catastrophic when things are not. The CEO who finds out from a market alert, a customer complaint, or a vendor escalation is a CEO whose information gap has already become a consequence.
What FacctorX Delivers
FacctorX is built specifically to close this gap.
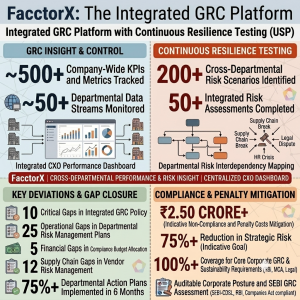
It is not a department tool. It is not another analytics platform that gives IT more data or gives finance more reports. It is the consolidated CXO view that sits above every department’s system and surfaces the numbers that matter to the person who governs the whole.
FacctorX connects to the data sources your company already uses. CRM for sales pipeline. HRMS for people metrics. ERP for operations and finance. IT monitoring tools for technology health. Procurement systems for vendor data. Compliance management tools for regulatory status. It does not replace any of these. It reads the numbers that exist in all of them and consolidates them into a single executive dashboard.
What the CEO sees when they open FacctorX:
A single company health score, trended over the past four quarters, showing whether the organisation is improving or declining overall.
Six to eight department-level indicators, each with a current number, a target, a trend line, and a threshold indicator showing green, amber, or red based on rules the CEO has set.
An exception list. Not everything. The specific numbers that have crossed a threshold this week and require a decision or, at minimum, an awareness.
A drill-down capability. The CEO who sees attrition at 4.2% can look at which departments, which grades, which tenures, and which locations are driving the number. Not because the HR system produced a report for them. Because FacctorX pulled the underlying data on request.
A board reporting module. The same numbers, in the same format, exported as a board pack that arrives with trend lines and threshold indicators rather than department narratives and supporting adjectives.
The Difference Between a Company Governed by Numbers and One Governed by Words
This difference is visible in how the leadership team operates.
In the company governed by words, the Monday morning executive meeting is a round of updates. Each department head reports what happened last week and what they plan for this week. The CEO listens, asks a few questions, and moves to the next department. The meeting surfaces what each department head chose to surface. It is a curated view of the organisation.
In the company governed by numbers, the Monday morning executive meeting opens with the FacctorX dashboard on the screen. Every department head can see every other department’s numbers. Before anyone speaks, the CEO has already identified the three numbers that require discussion this week. The conversation starts with the exception, not with the update. The team spends its time on what the numbers say needs attention, not on what each function wants to present.
The difference in outcome is significant. The company governed by words is reactive. It finds out about problems when they surface in department head reports, which happens after the problem has developed enough to be worth mentioning. The company governed by numbers is proactive. It finds out about problems when the numbers cross a threshold, which happens before the problem has produced consequences.
This is not a technology advantage. It is a governance advantage. And it is available to any company that decides to replace the word with the number.
Why This Matters More Now Than It Did Five Years Ago
Five years ago, the case for consolidated CXO visibility was a best-practice argument. Companies that had it made better decisions. Companies that did not made decisions based on incomplete information. The difference was meaningful but not urgent.
In 2026, the argument is different. It is not about making better decisions. It is about being able to make decisions at all in an environment that changes fast enough to make quarterly narrative reporting structurally obsolete.
Global cybercrime costs reached $10.5 trillion annually in 2025, making it the third-largest economy in the world if measured as a country, behind only the United States and China. SEBI now requires listed companies to disclose material cybersecurity incidents within 24 hours. RBI requires a six-hour notification for significant cyber events. The DPDP Act creates obligations that must be responded to within prescribed timelines. Vendor SLA breaches compound faster than quarterly review cycles can catch them. Attrition in competitive talent markets can go from manageable to critical in sixty days.
A quarterly board pack that consolidates last month’s information is not the right instrument for this speed of change. Neither is a monthly executive meeting where each department head has one slide.
The companies that will make good decisions in this environment are the ones where the CEO has a dashboard that shows today’s numbers and yesterday’s trend. Not last quarter’s narrative.
Final Thought
Revenue reporting took decades to reach its current level of precision and credibility. Finance teams built standards, implemented systems, established reporting cadences, and created governance structures that made the CFO’s numbers trustworthy enough to govern a company against.
Every other department is at an earlier stage of the same journey.
Sales has CRM data but not always a CEO-level view of what it means for revenue confidence. HR has people systems but not always a board-level view of what attrition means for delivery capacity. Operations has production data but not always a consolidated view of what OEE and rejection rates mean for customer commitments. IT has monitoring data but not always an executive view of what patch compliance means for the company’s risk exposure.
FacctorX is the infrastructure that completes this journey for every department simultaneously. Not by creating new data. By consolidating what already exists into the format leadership actually needs: a number, a target, a trend, and a decision threshold.
The companies that deploy it will look back on their word-based governance era the way finance teams look back on spreadsheet-based accounting. Not with nostalgia. With a clear understanding of why the upgrade was necessary and why they should have made it sooner.
FacctorX is Skeletos’s consolidated CXO visibility platform. It gives CEOs, CFOs, and boards a single real-time dashboard across every department of the company, like sales, finance, operations, HR, IT, vendors, and compliance, replacing departmental narrative with the numbers that actually govern. If you want to understand what your company’s dashboard would look like today and which numbers would demand your attention first, talk to us.